
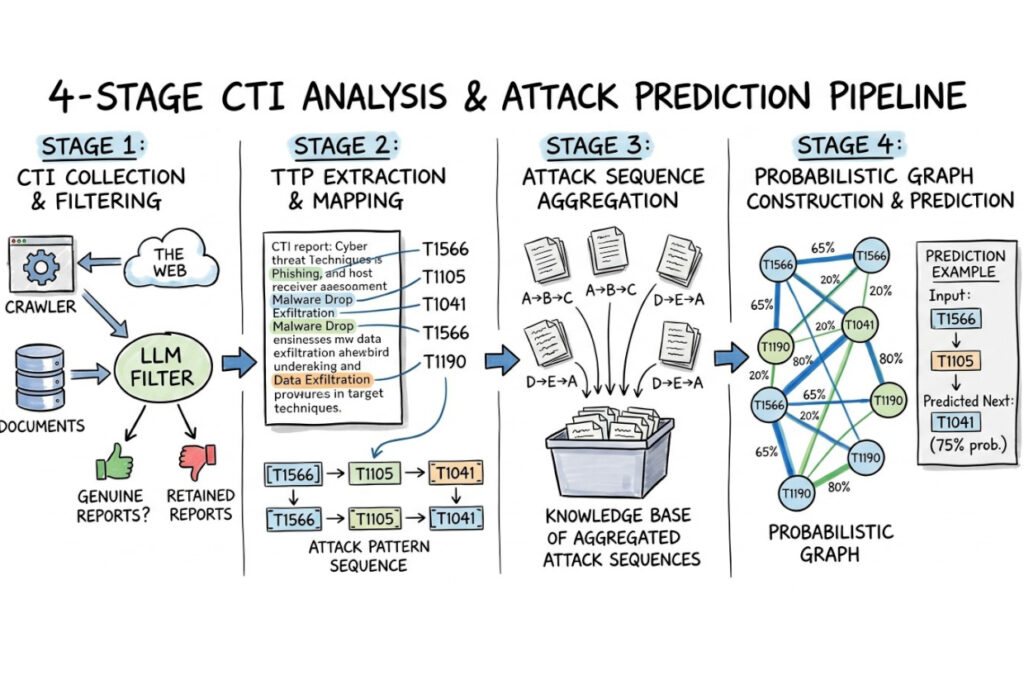
Imagine a burglar trying to break into a high-tech smart home. If you knew exactly which window or door they were going to try next, you could stand right behind it and catch them in the act. In the digital world, this is the ultimate goal of cybersecurity.
Cyberattacks rarely happen completely at random. Hackers usually follow specific, structured paths and methodologies to reach their targets. Today, security experts are developing a groundbreaking tool to exploit this predictability: a Probabilistic Graph. This is an intelligent mathematical model capable of analyzing an ongoing cyberattack in real time and predicting—with high statistical confidence—what the hackers will do next. Building this predictive crystal ball relies on a sophisticated four-stage pipeline that turns messy, scattered internet data into an active defense shield.
Stage 1: Gathering the Digital Clues (Cyber Threat Intelligence)
The first step is all about data collection. Every single day, cybersecurity analysts around the globe publish detailed post-mortem reports on recent cyberattacks. These documents are known as Cyber Threat Intelligence (CTI) reports.
- The Challenge: The internet is flooded with information, but not all of it is accurate, high-quality, or relevant.
- The Solution: The pipeline automatically scans the web to harvest these CTI documents. It then puts them through a strict filtering process. Only reports containing concrete, valuable blueprints of actual cyberattacks are kept, while the digital “noise” is discarded.
Stage 2: Decoding the Hacker’s Playbook
Once the high-quality reports are selected, the system dives deep into the text to extract the underlying strategy of the attack.
- Identifying Techniques: The system automatically extracts the specific technical methods the attackers used.
- The Importance of Timing: In cybersecurity, order matters. The system tracks the exact chronological sequence of events—noting, for example, that the hackers first sent a phishing email, then stole user credentials, and finally encrypted the database.
- Standardizing with MITRE ATT&CK: To ensure everyone speaks the same language, each extracted technique is linked to the MITRE ATT&CK framework—a globally recognized dictionary of hacker behaviors.
By the end of this stage, the raw text is transformed into a clean, chronological sequence of standardized technical steps.
Stage 3: Connecting the Dots
A single attack report shows you how one specific hacker thought on a Tuesday. However, when you look at hundreds of attack reports together, you begin to see how the entire hacking ecosystem operates.
In the third stage, the pipeline takes the individual attack sequences extracted from various reports and merges them into a single, unified dataset. This massive library of combined historical data serves as the foundation for the predictive model, teaching it the common habits and behavioral patterns of cybercriminals.
Stage 4: Creating the Predictive Graph
In the final stage, all the combined historical data is transformed into a Probabilistic Graph. Think of this graph as a digital roadmap with multiple interconnected intersections. Each “stop” on the map represents a specific attack technique, and the roads connecting them are weighted with mathematical probabilities.
When a company detects a new cyberattack in progress, their security team inputs the malicious activities they have observed so far. The graph instantly analyzes the data to:
- Map out the most common paths historically taken from that specific starting point.
- Calculate the statistically most likely next step the attacker will take.
Why This Changes the Game
Historically, cybersecurity has been reactive: organizations waited for an alarm to trip and then scrambled to fix the damage. By utilizing probabilistic graphs, the industry shifts toward predictive defense. Security teams can now anticipate their opponent’s next move, fortify the exact vulnerability about to be targeted, and stop a cyberattack before the worst damage is ever done.